Hexvoyant

Local binary analysis. Built with Rust.

Hexvoyant v0.1 / alpha

Raw bytes.
Clearer
answers.

A local binary analysis workbench for macOS. Read instructions, follow references, and find the structure inside Mach-O, PE, and ELF files. Your files stay on your machine.

Native macOS app · Built with Rust

Animated silver Metagross with a gold cross and four steel legs
THE MIND BEHIND THE MACHINE0376

One workbench. Three binary formats.

Mach-OPE / COFFELFARM64x86-64

The workbench

A little curiosity goes a long way.

Explore a recorded analysis. Real output from our own C fixture. Try the tabs, follow an address, or export the report.

Loading sample…Owned fixture snapshot
Static · local
Analysis ready SCHEMA READ-ONLY OWNED FIXTURE
Loading owned fixture analysis…

Native app / verified captures

The real macOS workspace.

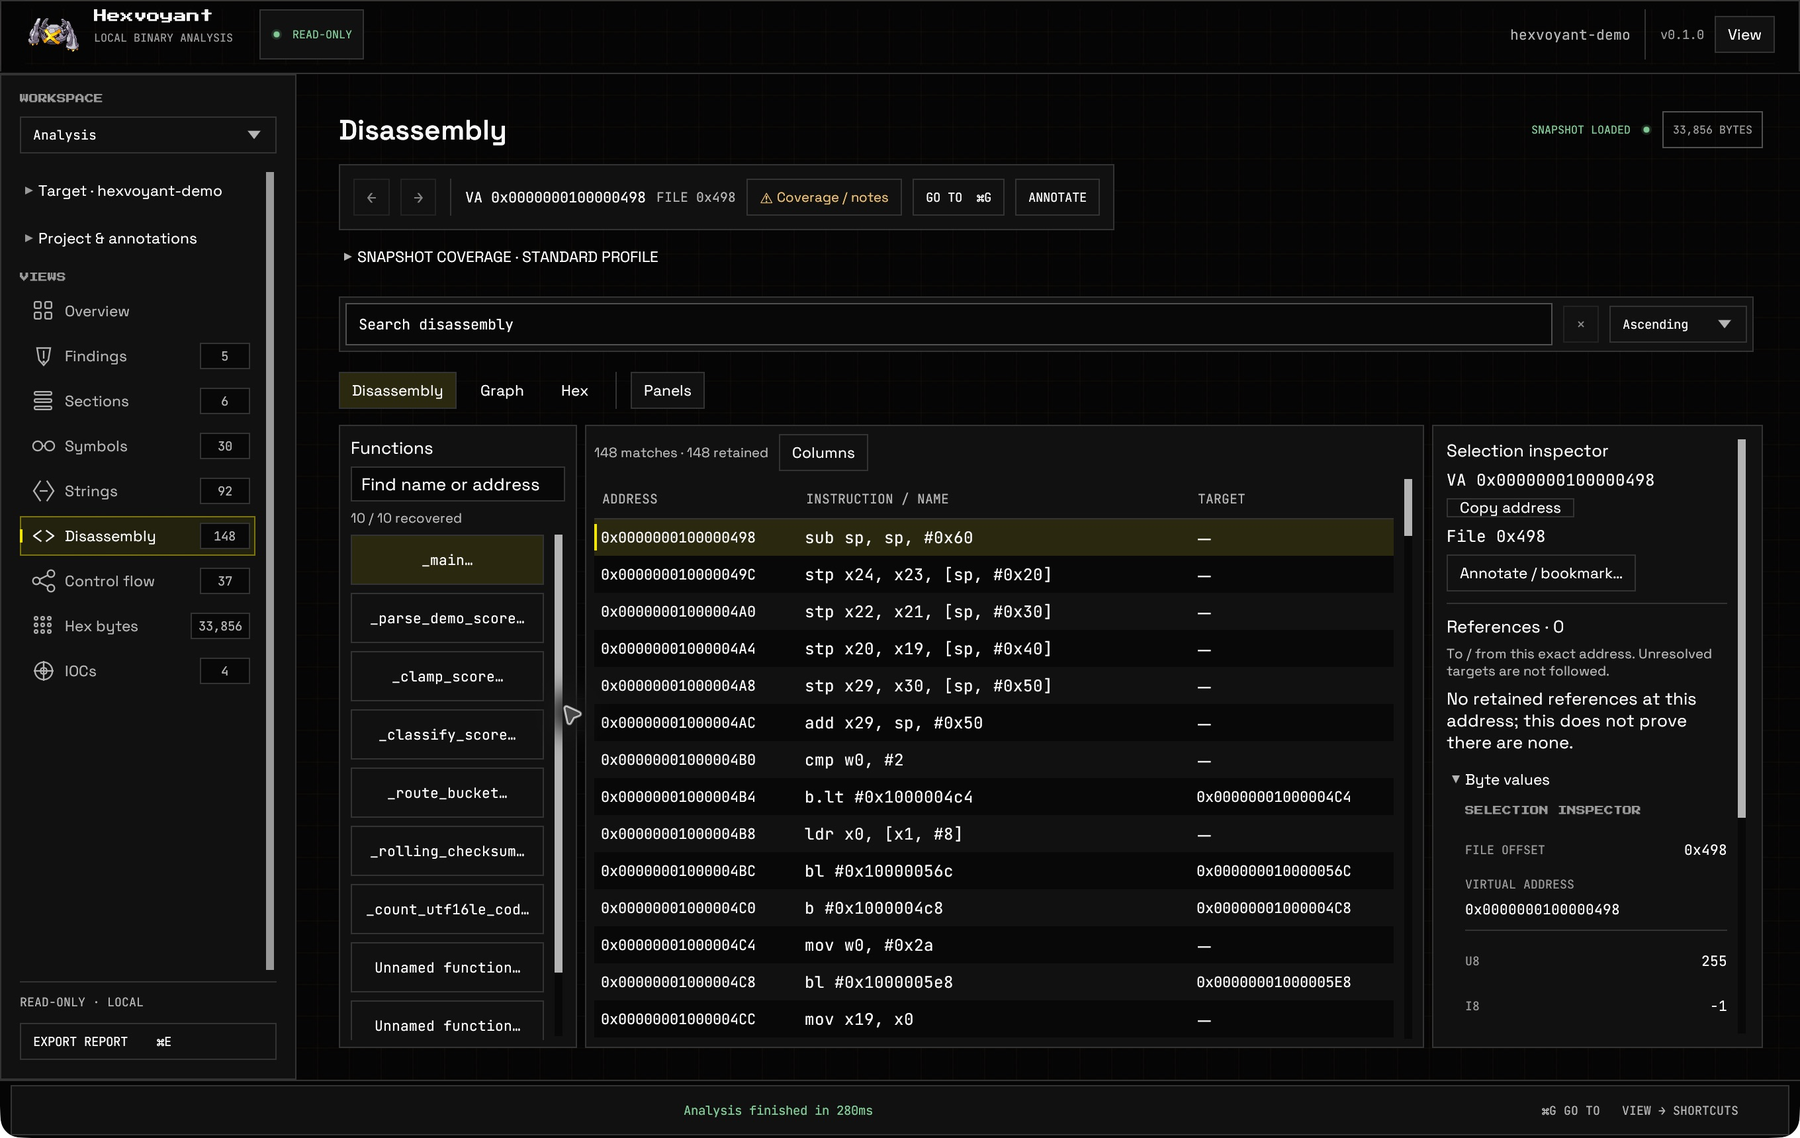
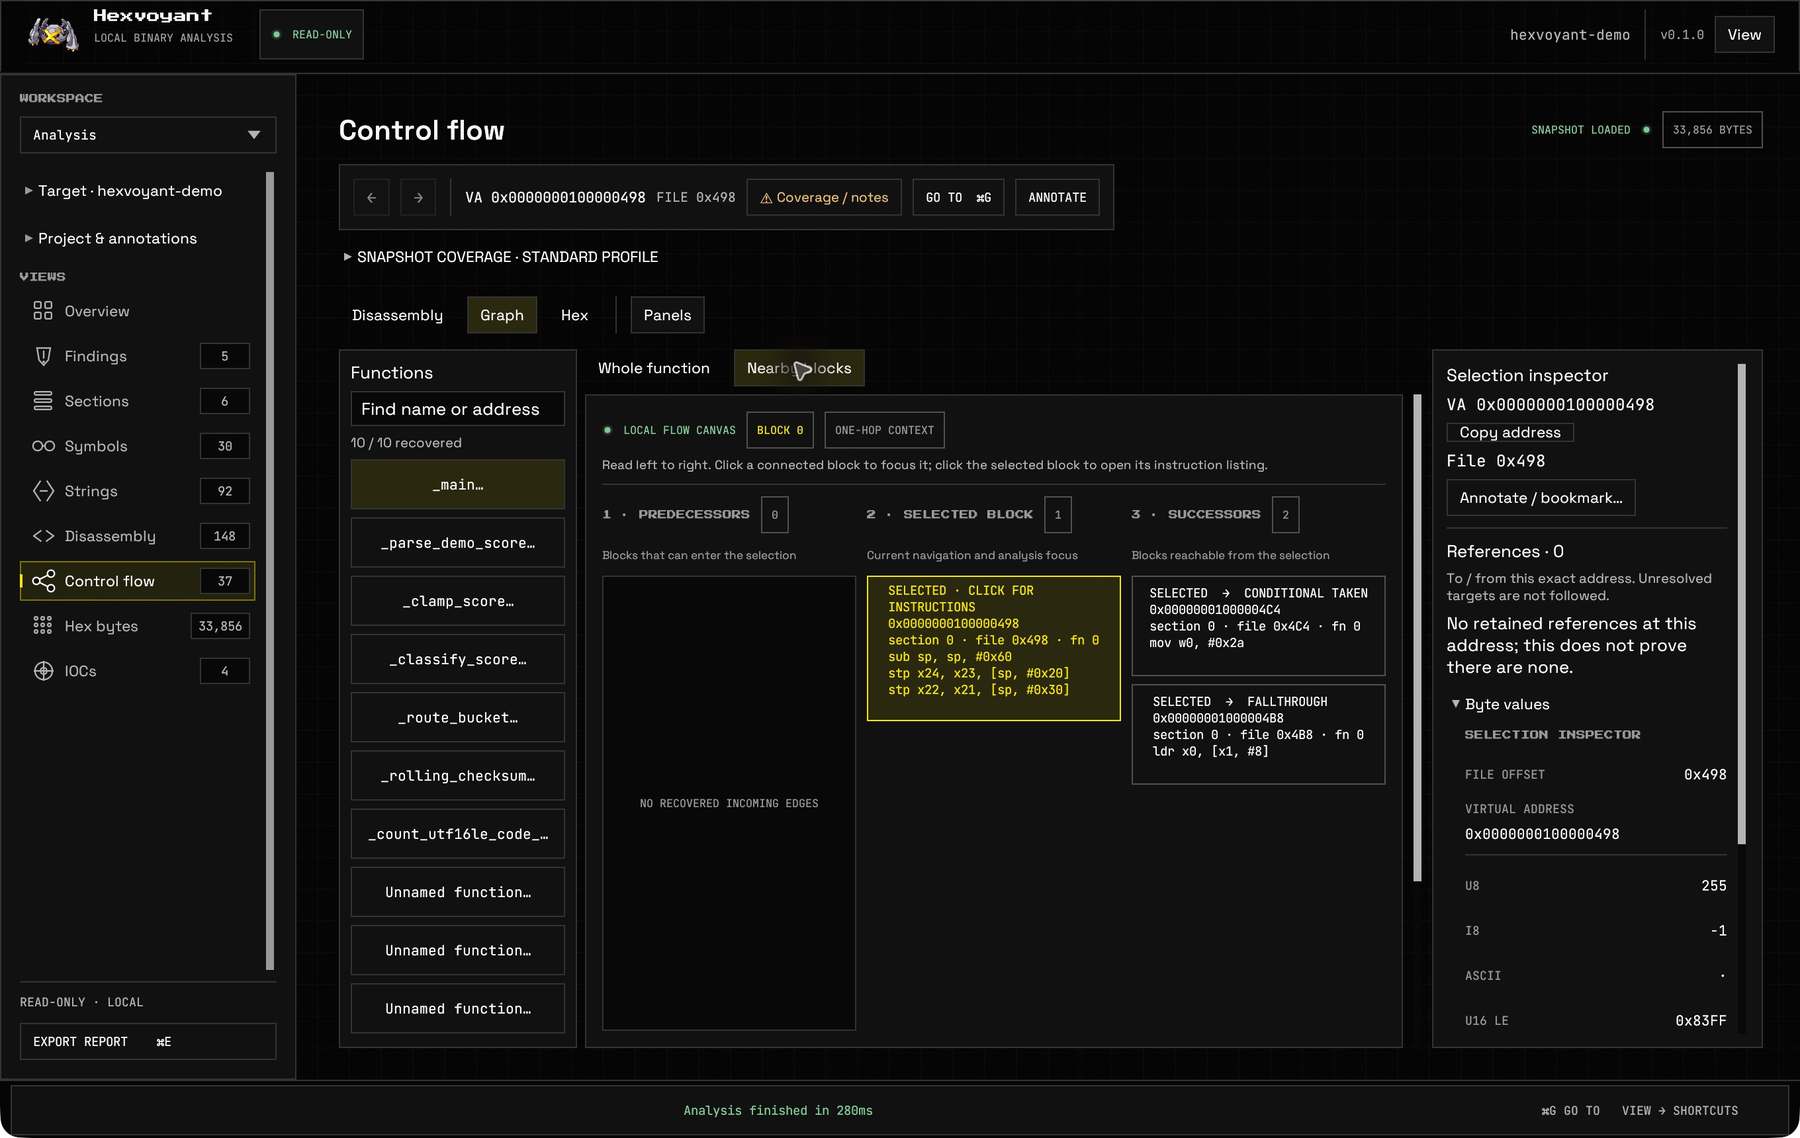
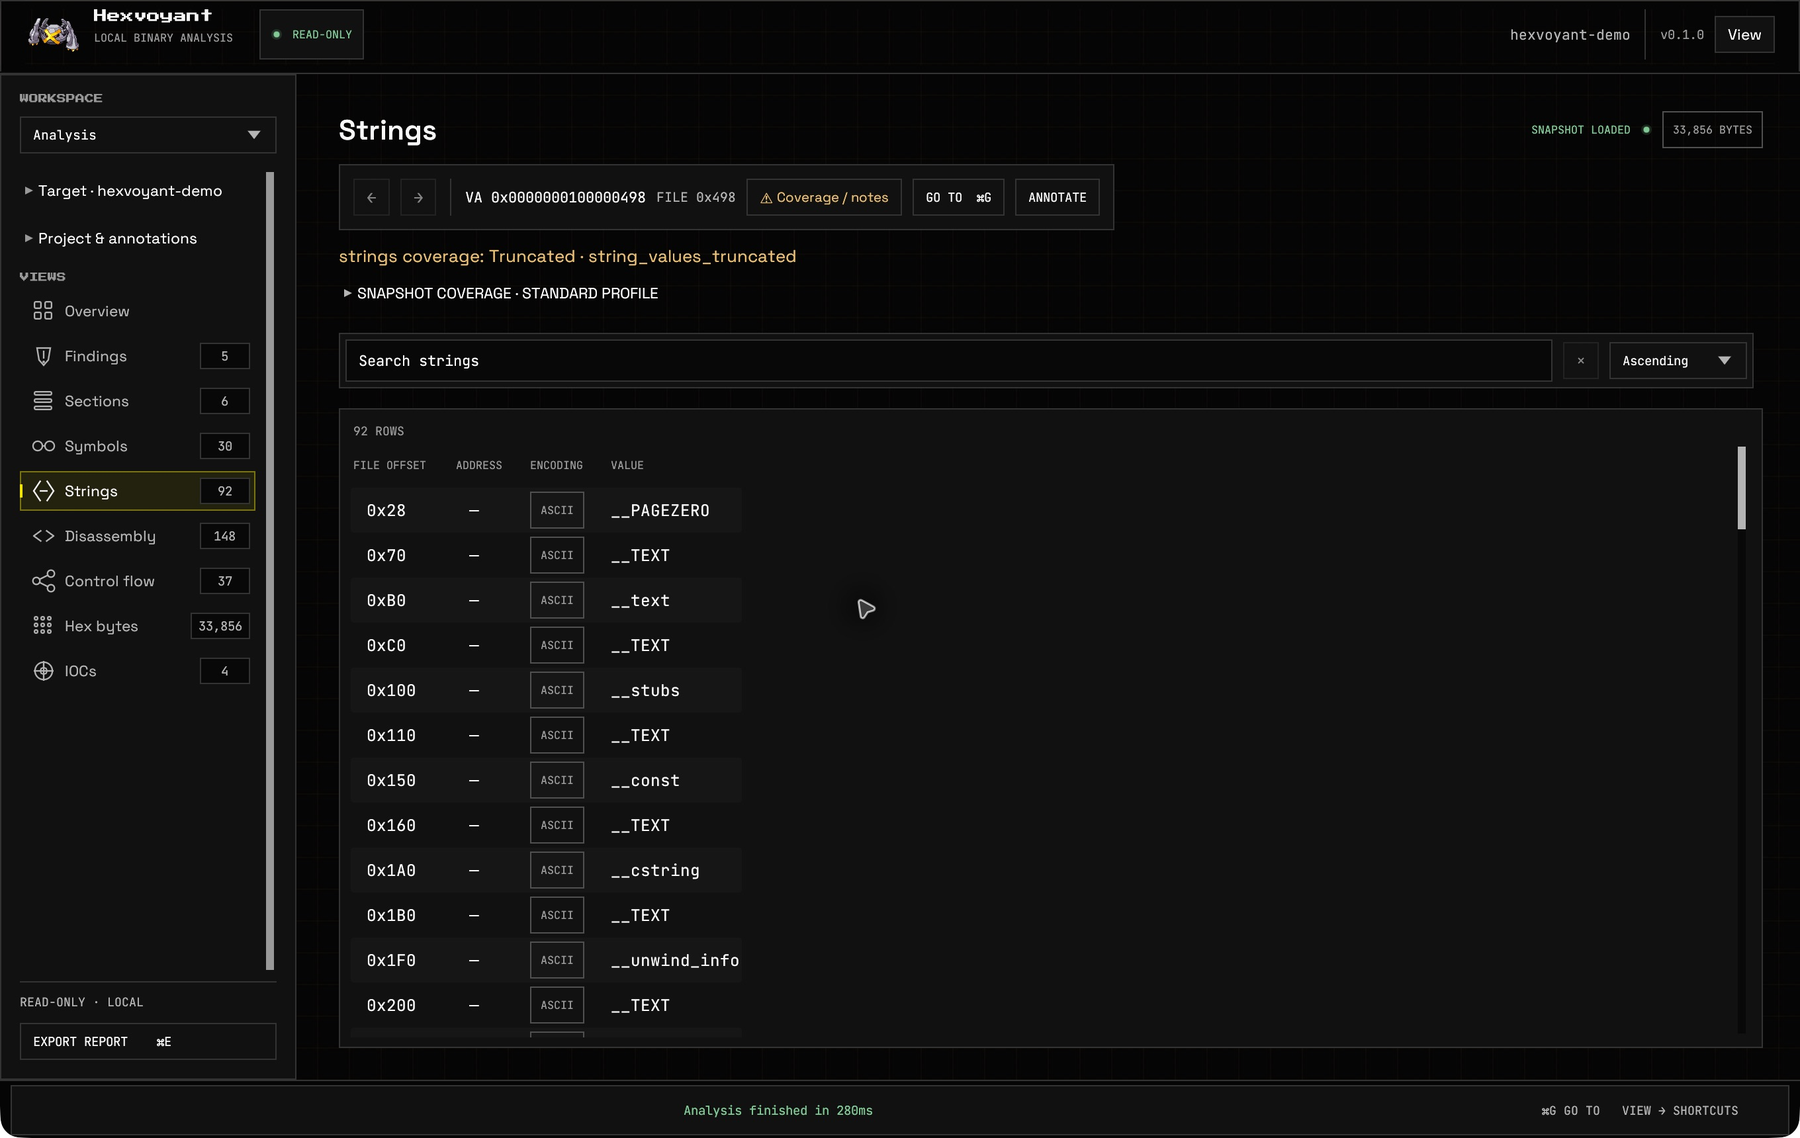
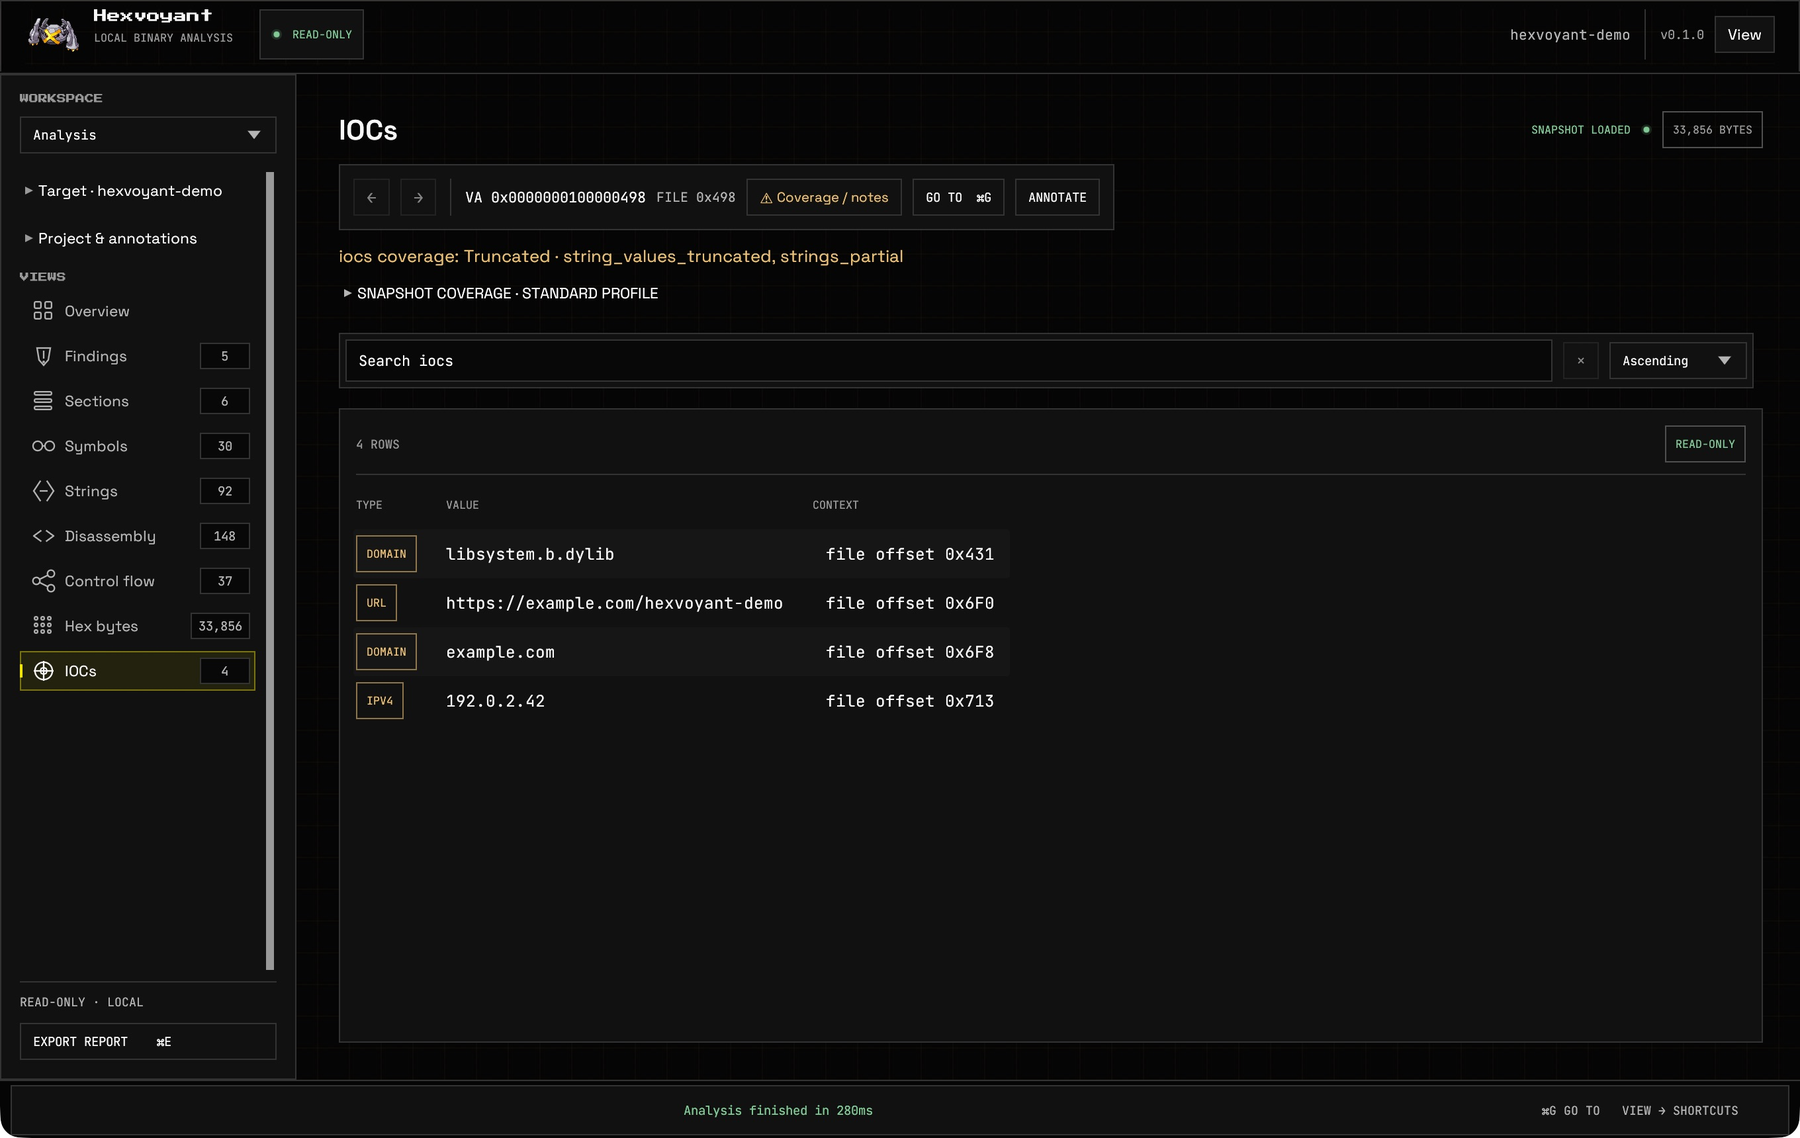
Captured from Hexvoyant 0.1.0 while statically inspecting the repository-owned benign fixture. The fixture was parsed, never executed. These captures show the Metagross interface in the native app, including its connected analysis views.

Hexvoyant native instruction listing with addresses, bytes, ARM64 instructions, navigation controls, and selection inspector
01 / ListRead instructions at a selected address
Hexvoyant local flow canvas showing one focused basic block and its typed outgoing conditional and fallthrough edges
02 / FlowFollow a block’s incoming and outgoing paths
Hexvoyant native Strings workspace showing the bounded extracted-string table for the owned fixture
03 / StringsFind text and its location in the file
Hexvoyant native IOC workspace showing documentation-only indicator rows from the owned benign fixture
04 / IOCsEvidence with explicit limits

Presentation captures—not golden UI tests or claims of parity with established reverse-engineering suites. Fixture SHA-256: 04b55233…a317a7ef

In your toolkit

Find your way through the binary.

Start with the file. Follow the evidence. Six ways to explore what your software is made of.

Binary ExplorerShiny Metagross — Binary Explorer

01 / FILE STRUCTURE

Start with the structure.

Headers, sections, imports, exports, symbols, and strings in one place.

Show full description

Inspect Mach-O, PE/COFF, and ELF metadata. Every result retains its file identity, address mapping, and analysis coverage.

Explore sections
DisassemblyShiny Metagross — Disassembly

02 / INSTRUCTIONS

Read what actually runs.

ARM64, x86, and x86-64 instructions with addresses, bytes, and references.

Show full description

Jump between a call and its resolved target. Share the same virtual address and file offset across the native instruction, graph, and byte views.

Read the code
Control FlowShiny Metagross — Control Flow

03 / CONNECTIONS

Follow the possibilities.

Basic blocks, function graphs, and typed edges make branches easier to follow.

Show full description

Explore a bounded function graph in the desktop app, with zoom, pan, and pagination. Unresolved and ambiguous references stay explicit.

Open the desktop
Exact DiffShiny Metagross — Exact Diff

04 / TWO BUILDS

See what changed.

Compare two builds with exact evidence and a clear match basis.

Show full description

Inspect additions, removals, compatibility, fingerprints, and coverage for each input. Incomplete or ambiguous evidence remains visible.

Compare locally
Apple InternalsShiny Metagross — Apple Internals

05 / MACH-O & BUNDLES

Look beyond one slice.

Explore universal Mach-O files, load commands, and Apple bundle contents.

Show full description

Dedicated desktop workspaces inspect accepted Mach-O slices and discover bundle candidates. Signature structure is reported separately from signer trust.

Explore on macOS
Local AutomationShiny Metagross — Local Automation

06 / CLI & MCP

Build your own workflow.

A CLI, JSON and Markdown reports, and 18 typed local MCP tools.

Show full description

Use bounded queries, authenticated loopback automation, saved projects, and separate annotations. Your inspected binary is never launched.

Get started

Honest scope: Hexvoyant is an early static-analysis MVP. It does not yet promise decompilation, malware verdicts, full debugger coverage, or parity with established tools.

Your next move

From curious to hands-on.

An early alpha for learning static analysis and inspecting authorized binaries. Start with the owned fixture; no account or file upload is needed.

01 / Browser preview

Look around first

Explore a recorded analysis of our own C fixture. This website does not analyze your files; it demonstrates selected desktop concepts.

Explore the fixture

02 / Native macOS app

Analyze a local file

Build the desktop from source with Rust and Xcode Command Line Tools. Python 3 builds the fixture provenance. No App Store account is needed.

Build & first-session steps

03 / Help test the alpha

Tell us where you get stuck

Try five short tasks, then keep a local feedback sheet. Nothing is submitted automatically. Share only redacted feedback with the person who invited you.

Download tester checklist

Under the hood

Small layers. Visible boundaries.

The code keeps parsing, interface code, automation, and future debugger access separate. Normal frontend analysis uses a supervised worker; it is not an operating-system sandbox.

Later, behind a separate capability boundary
LLDB adapterlaunch · registers · memory · breakpoints

Built to stay local

Local means local.

The static MVP has no accounts, hosted relays, or automatic uploads. Automation starts in inspect mode, and every future mutation must cross an explicit capability boundary.

The tool cannot prove a binary is safe.
  1. 01
    Loopback only

    The current listener rejects nonlocal peers and requires a fresh random bearer token.

  2. 02
    Inspect by default

    Reading metadata is separate from observing a process, changing memory, or taking dangerous actions.

  3. 03
    Audit the automation

    Requests and capability decisions belong in a reviewable session timeline.

  4. 04
    Assume hostile input

    Parser limits, deterministic fixtures, and explicit failure states are current; dedicated fuzz targets are planned next.

The journey so far

A work in progress. Out in the open.

The static core and its three interfaces are implemented. Every next milestone keeps a testable exit condition instead of promising full tool parity.

  1. 01

    Now · static evidence workflow

    Core + three interfaces

    Owned fixtures, functions/xrefs, evidence-backed findings, exact diff, multi-slice Mach-O, bundle discovery, CLI, dedicated desktop workspaces, and authenticated local MCP.

  2. 02

    Now · project lifecycle

    Projects + cancellation

    Saved projects and annotations, named-stage progress, analysis profiles, paged bytes, supervised native workers, and schema-3 per-collection coverage.

  3. 03

    Next · validation and depth

    Release evidence + references

    Complete browser and release-audit runs, review upstream notices, then deepen relocations/data references, debug symbols, fuzzing, and measured performance budgets.

  4. 04

    Planned · observe

    LLDB boundary

    Owned development fixtures, explicit process permissions, bounded memory reads, and an append-only audit timeline.

Made to be explored

Built to be inspected.

Explore the owned fixture, try the source-build alpha, and help make the first analysis session easier.